MarketFox
Business
Argentine Stocks - Vámonos!
September 17, 2024
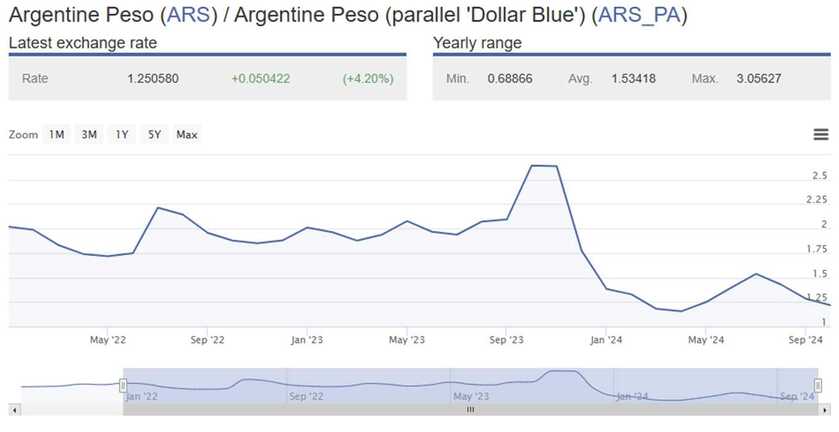
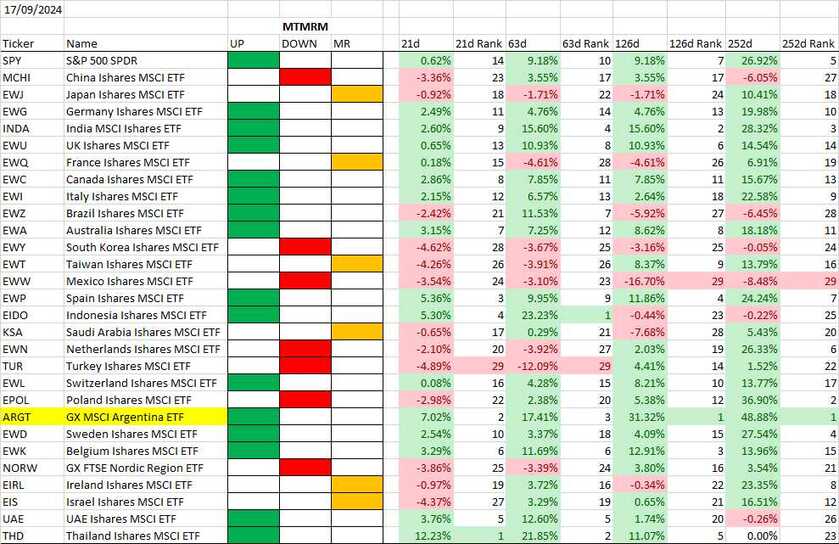
Argentina is the best performing stock markets in 2024. The Global X MSCI Argentina ETF (ARGT) is up +48.88% (in USD) on a rolling one-year basis (see below). 
 
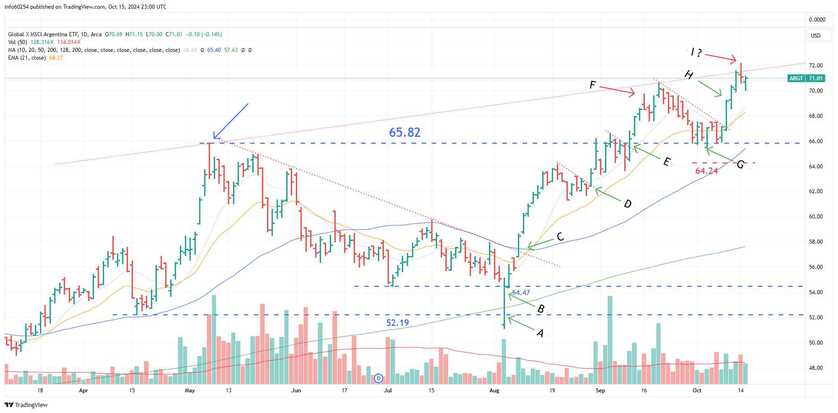
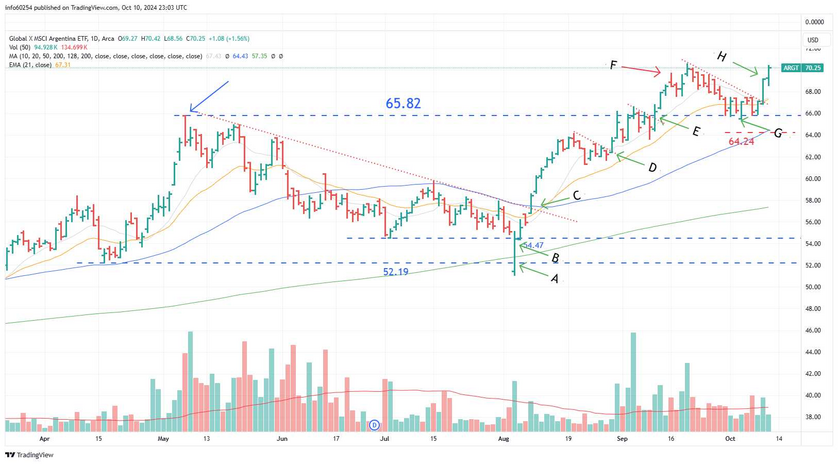
ARGT has presented some excellent trade entries over the last few weeks:
  • A = 5/8. Undercut of 16/4 low and rally. Also a moving average undercut and rally using the 200d moving average. This was the day of the Japan carry trade capitulation sell off. 
  • B = 5/8. Second setup on the same day. Rally through the 2/7 low. Big volume was an important clue
  • C = 8/8. Trendline breakout, rally though the 50d moving average and a pocket pivot (i.e. up on volume greater than the volume on any down day over the prior ten days). There was also a double-bottom entry the following day on 9/8 when ARGT cleared the midpoint of the "W" shape that forms the double bottom (i.e. high on 15/7). This is also where the potential head-and-shoulders top (see below) pattern was busted, which is a bullish sign.
  • D = 29/8. Moving average undercut and rally though the 10d moving average. This followed a seven-day consolidation where ARGT held tight (i.e. within 5% of the 20/8 high) on extremely low volume. Followed through on the next day with a pocket pivot.
  • E = 11/9. Breakout above the 7/5 high on above average volume. Also a pocket pivot. 
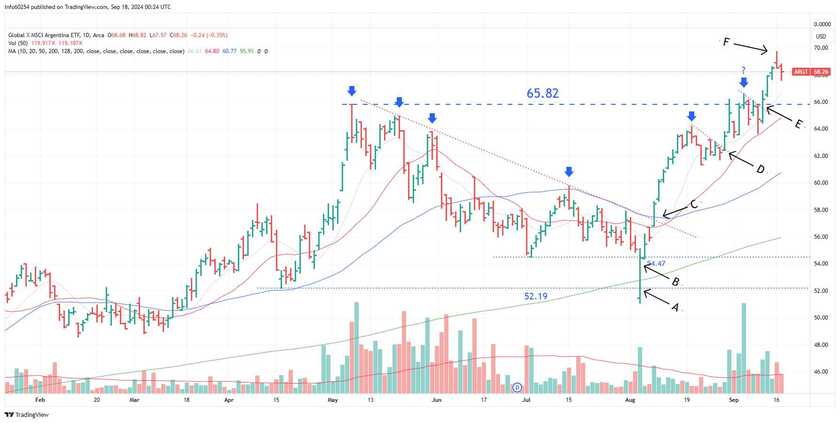
  • F = 16/9. Key reversal day (i.e. opens above the prior close, shoots up and then closes below both the open and the prior close) on high volume. This could be used as an aggressive short entry. Notice that all of the swing peaks over the last five months have ended with a key reversal day (blue arrows).
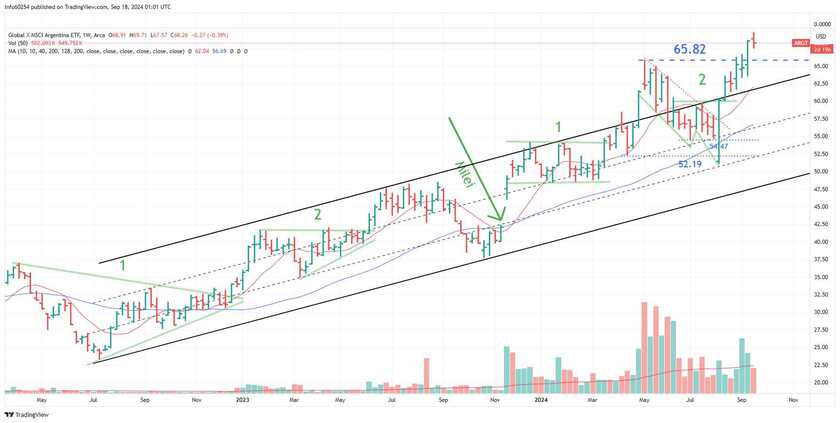
It looks like we're headed for a retest of the 65.82 breakout level (i.e. the 7/5 high), the round number of $66 and the rising 20d moving average.
 
Selling volume on the 16/9 reversal day and 17/9 is significantly lower than prior key reversals.
 
This suggests that demand > supply for ARGT. This strength means there's a chance that ARGT undercuts and rallies off the 10d moving average instead of the 20d.
 
Ideally a pullback to the 20d would be better, as it would work off some of the overbought condition and be a better setup for a sustained rally. That said, we can't control what the market will give us. 
 
The next major support level to the downside is the $63.80 to $64 range. That's the zone of the 31/5 high, the 20/8 high and the 10/9 low. Failing that, it's the top of the long-term uptrend channel (see below) around $62. 
 
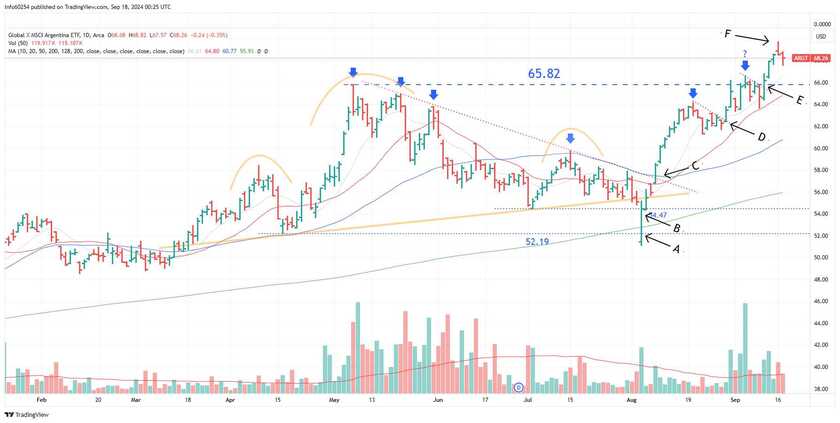
Entering on setups A & B would have required some courage as ARGT had triggered a head-and-shoulders top (shown in orange) with a nasty move to the downside. That said, the strong bounce on high volume on 5/8 had all of the features of a shakeout low.
 
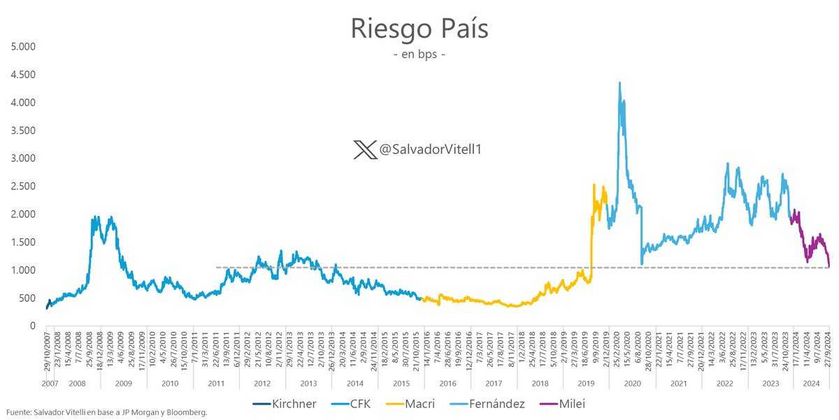
Zooming out, we see that ARGT started its long-term uptrend well before Milei was elected. Uncertainty around the Argentine election caused ARGT to briefly fall out of a stage two uptrend (i.e. 10w moving average above 40w moving average). Milei's win triggered a buyable gap up in ARGT. 
 
Since then, ARGT has formed two additional bases (or consolidations), a tight flat base between November 2023 and March 2024 and a more volatile double-bottom between May 2024 and September 2024. ARGT is now extended from this base and the long-term uptrend channel. That said, the long-term prospects for Argentine stocks look bullish.
 

The table below shows the main US Dollar denominated ETF for the world's 29 largest economies, ranked by GDP. Argentina is #22.


DISCLAIMER

This post is for educational purposes only. It is not a recommendation to buy, sell, hold or do anything at all. I don't know you or your circumstances, which are probably different from mine.

I'm trusting you to act like an adult. This means that you:
• Understand that no method of analysis is perfect
• Take responsibility for your decisions
• Set your risk level and decide on a risk management strategy before trading
• Don't "bet the farm" on any single trade
• Act quickly (i.e. sell) if a trade doesn't live up to your expectations

community logo
Join the MarketFox Community
To read more articles like this, sign up and join my community today
0
What else you may like…
Videos
Posts
Articles
S&P 500 Update 30/04

A quick video update on the S&P 500. Weight of evidence favours cautious optimism. That said, it remains a news-driven market.

DISCLAIMER

This post is for educational purposes only. It is not a recommendation to buy, sell, hold or do anything at all. I don't know you or your circumstances, which are probably different from mine.

I'm trusting you to act like an adult. This means that you:
• Understand that no method of analysis is perfect
• Take responsibility for your decisions
• Set your risk level and decide on a risk management strategy before trading
• Don't "bet the farm" on any single trade
• Act quickly (i.e. sell) if a trade doesn't live up to your expectations

00:06:17
S&P 500 Update 29/4/2025

FYI - See S&P 500 Chart in the Comments

DISCLAIMER

This post is for educational purposes only. It is not a recommendation to buy, sell, hold or do anything at all. I don't know you or your circumstances, which are probably different from mine.

I'm trusting you to act like an adult. This means that you:
• Understand that no method of analysis is perfect
• Take responsibility for your decisions
• Set your risk level and decide on a risk management strategy before trading
• Don't "bet the farm" on any single trade
• Act quickly (i.e. sell) if a trade doesn't live up to your expectations

00:05:42
ASX 200 - Uptrend Still Intact

ASX 200 still in an uptrend that began in Oct 23 and was confirmed by the higher low in Nov 23.

Uptrend = higher highs and higher lows (shown in green).

A short-term H&S top formed (shown in blue) resulting in a quick test of the 50d MA (blue) which held.

ASX 200 now trading above the right shoulder, suggesting that the H&S top may have failed.

Longer term uptrend remains intact until the ASX 200 makes a lower low, breaking down below the 50d MA and 7,600 (shown with an arrow).

DISCLAIMER

This post is for educational purposes only. It is not a recommendation to buy, sell, hold or do anything at all. I don't know you or your circumstances, which are probably different from mine.

I'm trusting you to act like an adult. This means that you:
• Understand that no method of analysis is perfect
• Take responsibility for your decisions
• Set your risk level and decide on a risk management strategy before trading
• Don't "bet the farm" on any single trade
• Act quickly (i.e. ...

post photo preview
Bitcoin (BTC) Consolidating after a Pullback from All-Time Highs

BTC now in a short-term MEAN REVERTING regime after a 31-day UP regime. It is currently down -10% from the all-time-high.

BTC short-term overbought but long-term oversold. A bounce is possible, but I would like to see evidence of demand, for example a breakout above USD $68k.

All of the volume has been to the downside. 5 major distribution days (daily price in bottom quintile versus the last 12m and higher volume than previous day) since the last major accumulation day (daily price in top quintile versus the last 12m and higher volume than previous day).

Is supply exhausted? Maybe. Ratio of up to down volume at depressed levels that usually mark a short-term bottom. Now we need to see some evidence of demand.

DISCLAIMER
This post is for educational purposes only. It is not a recommendation to buy, sell, hold or do anything at all. I don't know you or your circumstances, which are probably different from mine.

I'm trusting you to act like an adult. This means that you:
• Understand ...

Gold Looks Great

Spot the difference between the current breakout attempt and the previous four attempts:

  • Only four weeks since the previous attempt. There were 83 weeks between attempts #1 and #2, 60 weeks between #2 and #3 and 30 weeks between #3 and #4.
  • Correction of < -5% since previous attempt. There was a > -20% correction between attempts #1 and #2 and #2 and #3 and a > -10% correction between attempts #3 and #4.
  • Spread vs 10-week moving average < 5%. All previous attempts were > 5% above and the first two attempts > 10% above
  • 10-week moving average < 3% above 40-week moving average. This is the tightest spread between the two moving averages of any breakout attempt.

GLD is tightening up and becoming less volatile. This suggests that demand is strong.

DISCLAIMER
This post is for educational purposes only. It is not a recommendation to buy, sell, hold or do anything at all. I don't know you or your circumstances, which are probably different from mine.

I'm trusting you to act like an adult. This...

post photo preview
S&P 500 Update
Here's part of a note that I sent to Miura's client yesterday:
 
I think the S&P 500 is due for a pullback this week. Here are my reasons:
  • More than 80% of S&P 500 stocks are above their 5-day moving averages.
  • 1,3 and 5-day returns are statistically strong, suggesting some short-term mean reversion is likely.
  • S&P 500 now overbought on time horizons up to 21 days.
  • Option expiry at the end of the week on Friday 18/10.
  • Earnings season begins this week.
  • My studies of short-term up regimes lasting longer than 12 days (median since 1950) show that a drawdown is common/normal between days 22-35. 
My plan is to ride this pullback out. My reasoning is that:
  • A pullback is "normal", so long as it's contained to 2-3%.
  • We have a decent profit cushion on existing positions.
  • Miura isn't too exposed to mega cap S&P 500 stocks. 
I may need to start trimming exposure if the pullback is more severe than 2-3% down as this would likely end the short-term up regime. 
 
This turned out to be a precinct call. The SPY ETF was down -0.78% on higher volume. The main reason for today's sell off seems to be ASML's poor forward guidance. This sent the semiconductor sector down by more than 5%, dragging the tech heavy S&P 500 and Nasdaq 100 with it.
 
 
Overall the dashboard remains positive. The S&P 500 was overbought heading into today's session and the AMSL announcement was as good a reason as any to take profits. 
 
All three regime models - short, medium and long-term - are in UP mode. The S&P 500 is in an uptrend and breadth is strong. It is normal for a short-term UP regime to experience a pullback between days 22 and 35.
 
The one negative is that distribution (i.e. selling on large volume) is starting to add up. The S&P 500 has now racked up four major distribution days since its last major accumulation day.
 
Short, medium and long-term regime models are all aligned in UP regimes. This is one of the strongest regime combinations (4/15) since 1950. It is also the most common. The three combinations that perform better are:
  1. ST=U, MT = MR, LT = D
  2. ST=MR, MT = D, LT = D
  3. ST=MR, MT = D, LT = M
These combinations occur during the formation of a bottom after a bear market. Consequently, they don't occur very frequently. 
 
 
Breadth, as measured by the percentage of S&P 500 stocks above their individual moving averages, remains strong across all time horizons. 
 
All of the major indices, all of the style indices and 8/11 sectors are in short-term UP regimes. The medium-term regime dashboard looks very similar. 


DISCLAIMER

This post is for educational purposes only. It is not a recommendation to buy, sell, hold or do anything at all. I don't know you or your circumstances, which are probably different from mine.

I'm trusting you to act like an adult. This means that you:
• Understand that no method of analysis is perfect
• Take responsibility for your decisions
• Set your risk level and decide on a risk management strategy before trading
• Don't "bet the farm" on any single trade
• Act quickly (i.e. sell) if a trade doesn't live up to your expectations

Read full Article
Argentina Update 15/10
Argentine stocks continue to perform well, with Miura's holdings all up since the beginning of October:
  • ARGT +7.8%
  • BMA +14.7
  • GGAL +16.9%
  • IRS +9.3%
  • MELI +3.5%
  • YPF +17%
The Argentine market looks set for a possible pullback or consolidation here (point I). If I had to guess, I'd say that it would drift down to meet the rising 10d and 21d moving averages somewhere between $68 and $70. This would be normal and such a pullback/consolidation may present follow on buy setups. 
 

Meanwhile the fundamental backdrop in Argentina continues to improve. Argentina's credit spread dropped to 1,059 bps today, the lowest level in more than 5 years.
 

The spread between the black market exchange rate (the so-called "Blue Dollar") and the official exchange rate continues to narrow. Down from 2.6x when Milei got elected in October 2023  to 1.2x now.  I consider this spread to be a real-world, market-based measure of inflation expectations. 


DISCLAIMER

This post is for educational purposes only. It is not a recommendation to buy, sell, hold or do anything at all. I don't know you or your circumstances, which are probably different from mine.

I'm trusting you to act like an adult. This means that you:
• Understand that no method of analysis is perfect
• Take responsibility for your decisions
• Set your risk level and decide on a risk management strategy before trading
• Don't "bet the farm" on any single trade
• Act quickly (i.e. sell) if a trade doesn't live up to your expectations

Read full Article
¡Viva la libertad, carajo!

"Long Live Liberty Damn It!" - Javier Milei's viral catchphrase is a good description of the performance of Argentine stocks. 

Prior posts on the 1/10 and 17/9 covered several long entries (A, B, C, D, E and G) over the last few months for ARGT, the US-listed, Argentine ETF. 

Yesterday saw an additiona entry (H), a trendline break off support at the 10d and 21d moving averages. The breakout followed a low volume pullback to the May 2024 highs. 

Disclosure: Miura Capital currently has 22.8% of its capital invested in Argentine stocks.


DISCLAIMER

This post is for educational purposes only. It is not a recommendation to buy, sell, hold or do anything at all. I don't know you or your circumstances, which are probably different from mine.

I'm trusting you to act like an adult. This means that you:
• Understand that no method of analysis is perfect
• Take responsibility for your decisions
• Set your risk level and decide on a risk management strategy before trading
• Don't "bet the farm" on any single trade
• Act quickly (i.e. sell) if a trade doesn't live up to your expectations

Read full Article
See More
Available on mobile and TV devices
google store google store app store app store
google store google store app tv store app tv store amazon store amazon store roku store roku store
Powered by Locals